

Appearance
How our team reads the EasyTrace dashboard when CI turns red
When CI turns red, we want to know what changed before we open a long test log. We start on Overview: select the project and branch, scan the latest suite runs, then use the change tiles to decide which run needs attention. The page is at /app/overview; the old /app/dashboard URL redirects there.
Start with the run that changed
The Suites × recent runs matrix shows up to four runs per suite, oldest to newest. A suite that was green and is now red is where we start. From there, the four tiles summarize the difference between each suite's latest and previous finished runs on the selected branch:
| Tile | What we look for |
|---|---|
| New failures | Tests failing now that did not fail in the previous run. We open Triage and inspect these first. |
| Still failing | Tests failing in both runs. We keep them visible without treating them as fresh regressions. |
| Fixed | Tests that failed before and no longer fail. We check that the expected fix landed. |
| New flaky | Tests with a same-branch pass/fail outcome change now but no flaky change in the previous run. We check whether they need investigation or reflect an intentional fix. |
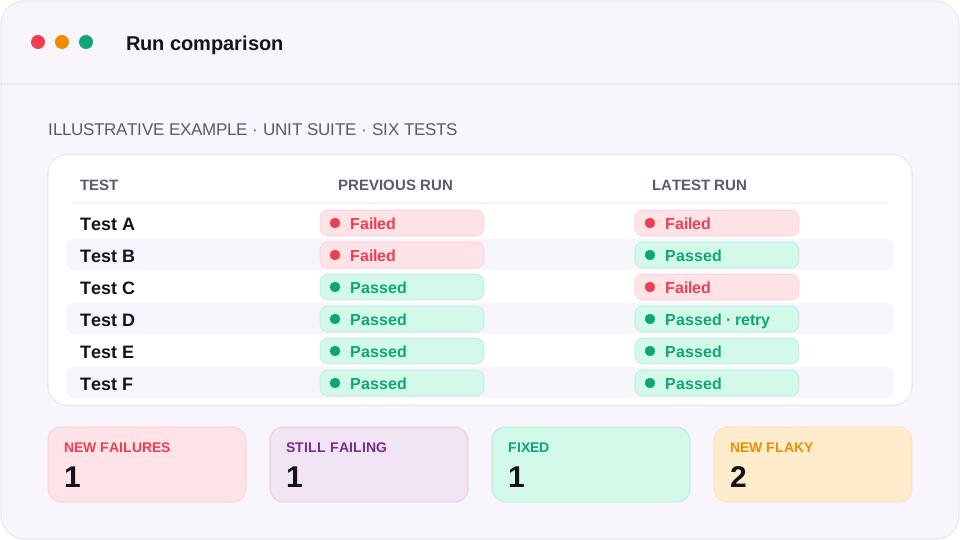
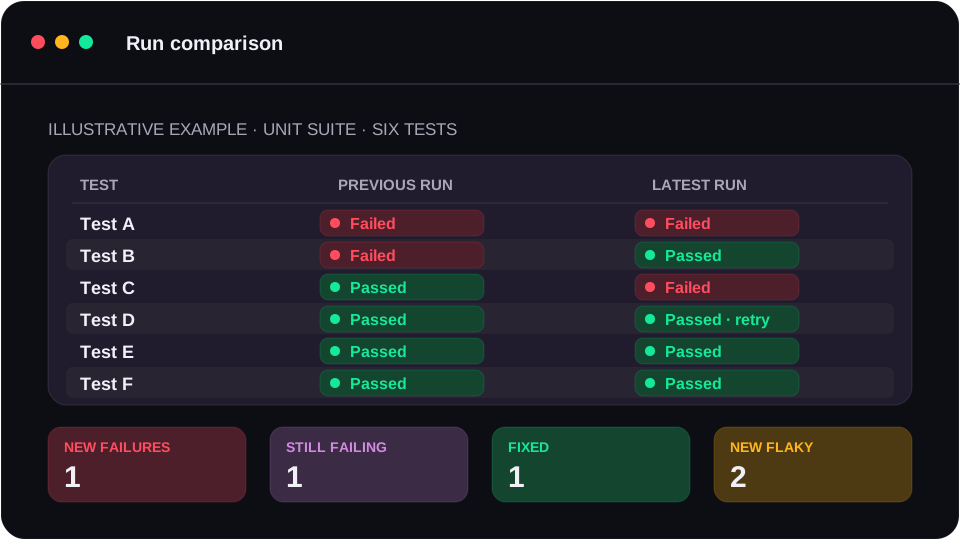
Here is a small illustrative example. In the previous unit run, A and B failed; C, D, E, and F passed. In the latest run, A and C fail, B, E, and F pass, and D passes after a retry. We would see 1 new failure (C), 1 still failing (A), 1 fixed (B), and 2 new flaky (B and C, assuming neither had a flaky change in the previous run).
D still counts as passed: its final result did not change across runs. We can inspect its failed attempt in the result history, but that retry alone does not create a flaky change. If a suite has no earlier finished run on the selected branch, its currently failing tests count as New failures. New flaky counts changes between runs; the project's flaky threshold applies to the separate Flaky tests rate.
Check the baseline before calling a failure new
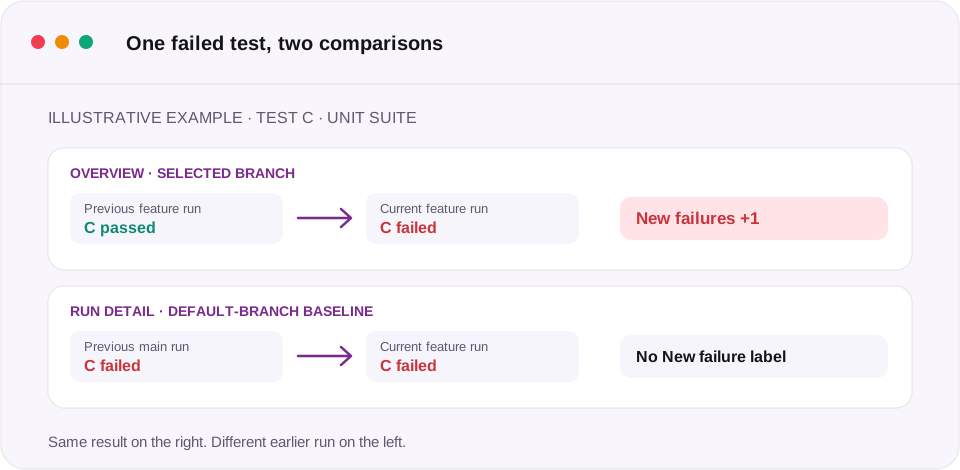
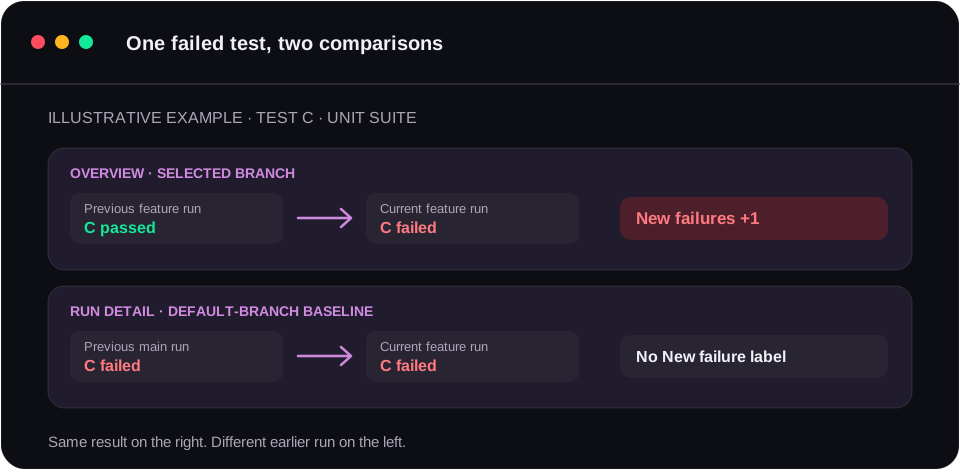
When we open Run Detail, its new failure label answers a different question from the Overview tile. Run Detail compares a failed test with the most recent earlier finished run of the same suite on the project's default branch. The test must have passed or been skipped in that baseline. A test absent from the baseline, or a project without one, gets no new failure label.
That distinction matters during feature branch review. Overview tells us what changed on the branch we selected. The label on a result tells us whether it broke relative to the default-branch baseline. A failure can appear in the Overview tile without carrying the label in Run Detail.
Step back and read the trend
Once we have dealt with the immediate failures, we switch the window to 7, 14, or 30 days. The right rail gives us two different signals:
| Metric | How we read it |
|---|---|
| Pass rate | Passed final results divided by passed plus failed final results. A test that passes after a retry counts as passed; skipped results are excluded. |
| Flaky tests | Flagged flaky test cases divided by test cases that ran in the window. A flagged test counts once, even if its outcome changed several times. |
For example, 90 passed results, including five passes after retry, plus 10 failed and 10 skipped results give a 90% pass rate. Four flagged tests out of 80 test cases that ran give 5% Flaky tests. If every result was skipped, Pass rate shows —.
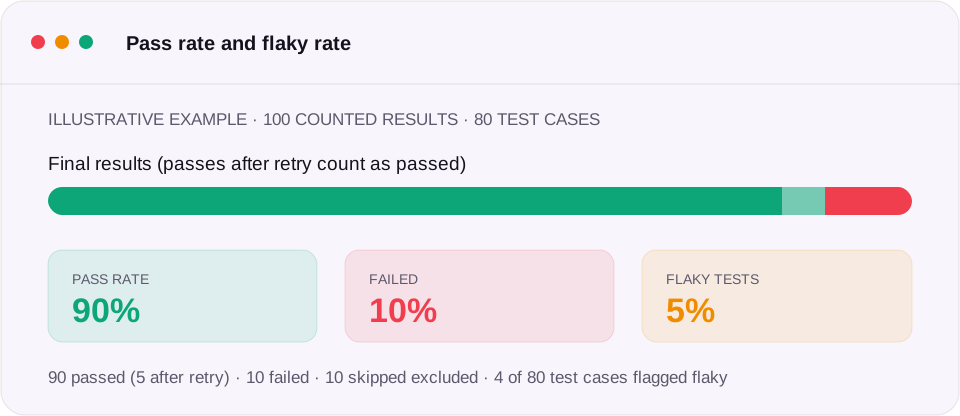
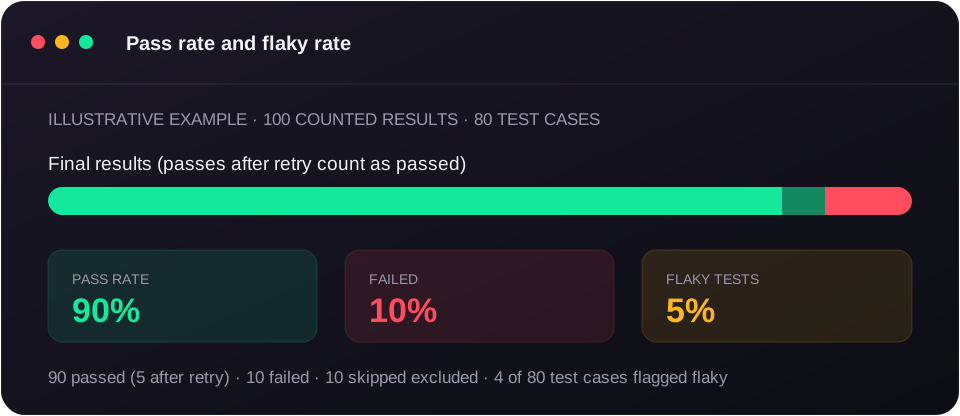
We watch Flaky tests when failures seem to move around. EasyTrace records a flaky change when a test switches from pass to fail or fail to pass between completed runs on the same branch. For each test, it divides those changes by its non-skipped results on each branch in the window and uses the highest branch rate. A test is flagged when it has at least one change and reaches the project threshold (5% by default). A pass on main and a fail on a feature branch do not form a change; neither does a retry within one run. See flaky detection if a test does not appear where expected.
We read the rates alongside volume. Runs includes finished runs, even interrupted ones; its failed count includes only failed runs. Test results includes passed, failed, and skipped results. The daily charts appear once the window has runs on at least three days. We use Runs per day to see how much activity sits behind a change in Pass rate per day. Days without runs have no pass rate, and runs belong to the UTC day they started.
The branch selector controls the suite comparison and latest runs. The rates use finished runs across all branches, though flaky changes are calculated within each branch. When we need the story for one branch, we open its Runs or Test health view. For more on the two failure comparisons, see baseline concepts and dashboard troubleshooting.