

Appearance
How our team watches coverage and run duration
Once we have checked new failures, we look for slower changes that a red or green CI badge cannot explain. On Overview, we use Coverage to see whether the share of covered code is falling and Median run duration to see whether feedback is taking longer. We read both alongside the failure and flaky-test signals.
Look for a coverage drop on the default branch
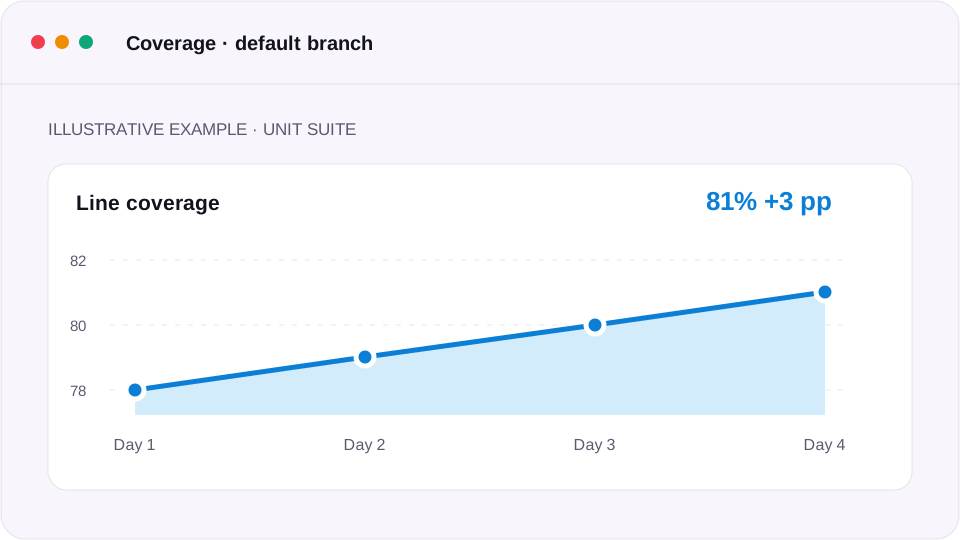
We start with Coverage · lines on <default branch>. Each suite row shows its latest line coverage and how much it moved in the selected 7, 14, or 30-day window. The series uses runs on the default branch; for each day, the latest-started run supplies the point. The displayed change is the last point minus the first, in percentage points. With one point, there is no change to show.
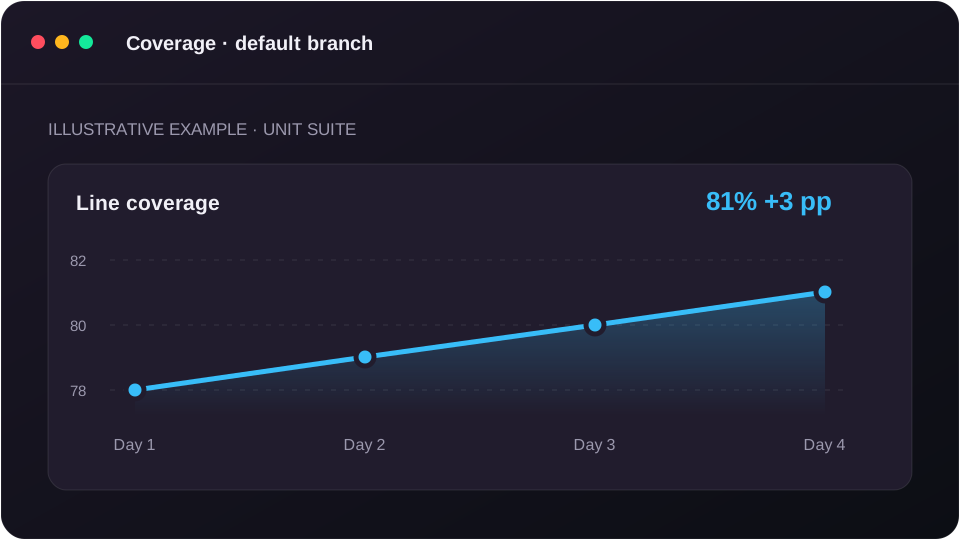
In this illustrative example, unit starts the window at 78% line coverage and ends at 81%. We read 81% and +3 percentage points on Overview. That tells us coverage rose across the window; it does not tell us which file changed.
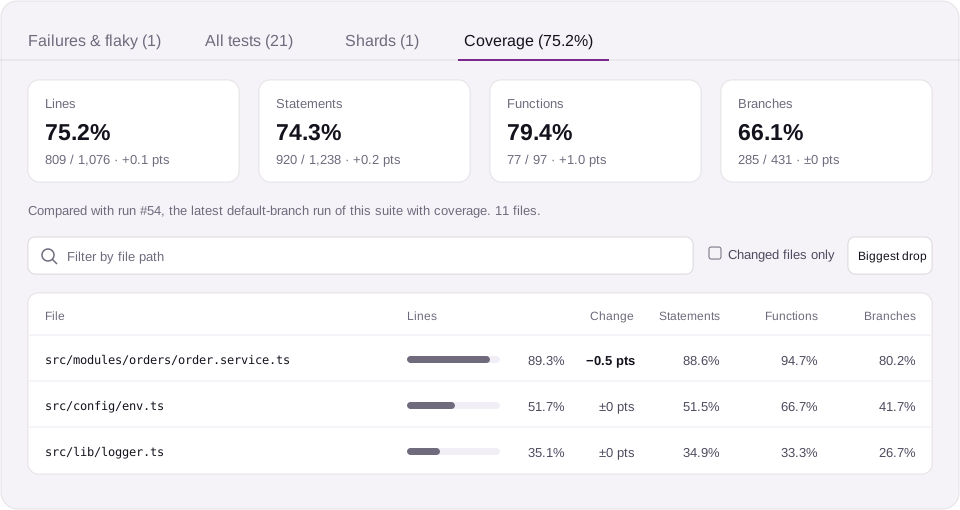
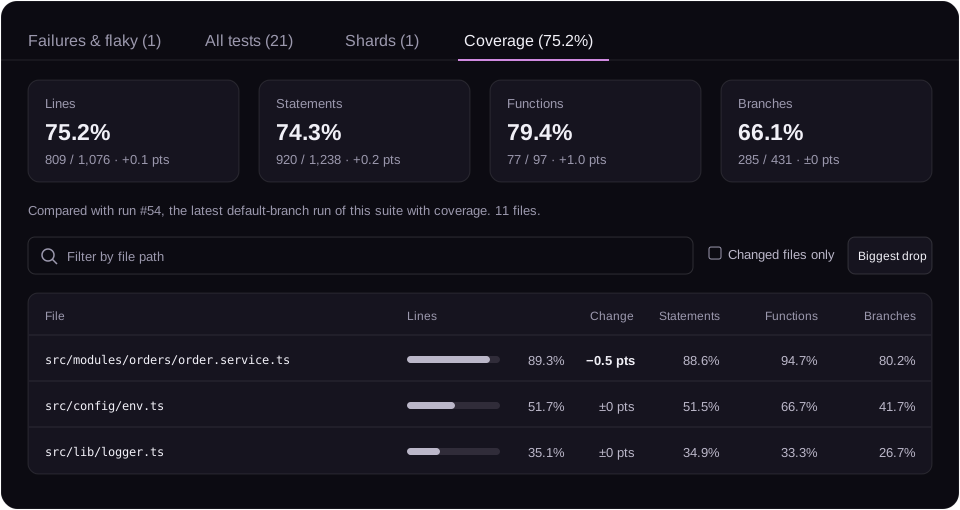
When the line falls, we open the suite's run and go to Coverage. The tab shows lines, statements, functions, and branches, with covered and total counts. We sort files by biggest drop or lowest coverage to find where to look next. Its delta uses the previous default-branch run of the same suite that uploaded coverage, so it answers a different question from the Overview window trend. Before that baseline exists, there is no delta.
Only suites that upload Istanbul JSON coverage from Vitest or Jest appear in this view. A Playwright suite, or a suite with no uploaded coverage, has no coverage row. Our coverage setup guide covers the file configuration and sharded runs.
Notice when feedback gets slower
We also check Median run duration for the selected window. It is the median elapsed time of passed and failed runs. If it rises, we open Latest runs or the Runs list and compare the suite and commit behind the longer runs. The single number tells us that feedback slowed down; the run details help us find where.
During coding and review, file-level coverage helps us notice new files and drops worth investigating. During integration and release, run duration tells us whether the team is waiting longer for CI. Neither number settles the quality of a change on its own, so we read them with new failures, Pass rate, and Flaky tests before deciding what to investigate next.